Buffer Overflows in 2025?
Buffer overflows are one of the oldest computer vulnerabilities, stemming all the way back to the invention of the C programming language in the 1970s. Despite the fact that they are well-known and have been exploited for over 40 years, they still account for a non-insignificant portion of zero days found in modern software. In 2024, buffer overflows still made the Mitre top 25 CWE list where it has held a spot since the beginning of the release of the list. In addition, memory safety vulnerabilities (which include buffer overflows) were prominent enough last year that the White House released a memo urging companies and developers to move from the use of languages like C and C++ to memory-safe alternatives like Rust or Golang.
Despite the warning, languages like C and C++ are still the most common languages for critical pieces of software like operating systems, firmware, network stacks, and drivers. With this being said, over the years, buffer overflows have become less prevalent than they previously were due in large part to built-in mitigations of operating systems, developer education, and automated tools for detection during and post-compilation.
For example, the classic stack overflow we’ll look at in this lesson would most likely not be exploitable on modern-day systems without multiple operating system mitigations being disabled. However, these mitigations are not always enough, and there are ways to bypass them by chaining together vulnerabilities. In this blog, we’ll start with the core basics, and then in further posts, we’ll add mitigations and learn methods to bypass them.
Introducing Overflowme!
Overflowme is a resource I created for learning about assembly and buffer overflows. It contains vulnerable binaries, source code, exploit code, and detailed walkthroughs. I’ve broken it down into multiple levels, each with a challenge of increasing complexity, such as bypassing mitigations. In this blog, we will walk through the first level of it where we’ll tackle a classic stack overflow to take control of a program’s flow of execution. You can find Overflowme in this GitHub repo. If you want to follow along with this blog, make sure to check through the prerequisites in the getting started section and install any you may need as I won’t be covering that in this blog.
Overflowme Level 1 – The Basics
The Challenge!
The challenge in Level 1 is to get the Overflowme binary to print out the hidden message “Hey you’re not supposed to be here!” (no cheating and modifying the source code though). If you don’t want any spoilers, then give the challenge a try without reading further. If you want the detailed walkthrough then buckle up, and we’ll get started exploiting this binary together.
Assembling and Linking the Binary
The first step we’ll need to do is to assemble and link the assembly source code. To make things easier, I’ve included a makefile.
make overflowmetext
Once it’s built, give the binary a run.
./overflowme
The binary is asking us not to overflow it, so we’ll play nicely first. Input a short string and notice how it simply echoes back whatever you input and then exits. Next, let’s see how we can overflow it and crash it. In this challenge, we’ll be working from the inside with access to the source code and a debuggable version of the binary. This is done so we can learn how the stack works and what makes programs vulnerable to overflows.
Reviewing the Source Code
The source code is located in the overflowme.s file. Crack it open, and we’ll review it to find the root of the vulnerability. For this level, I’ve provided the source code in assembly because, in my opinion, it’s the best way to learn about how the stack and memory allocation works, however, this vulnerability could easily be found in a poorly written C program. The source code actually started from C code that was compiled which I modified slightly to make it easier to read. Almost every line of code has a detailed comment explaining exactly what it’s doing. For that reason, I won’t specifically go over all of the code in this blog, however, if there are parts you don’t understand make sure to review the comments in the source code.

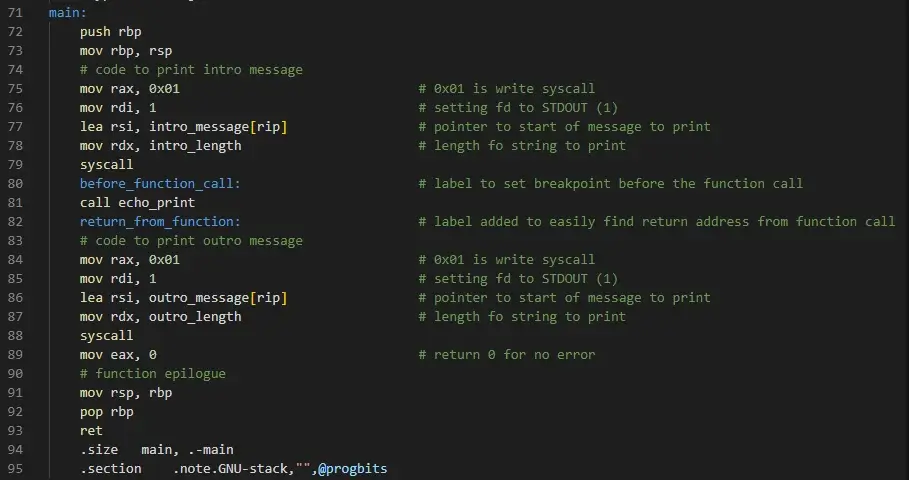
The entry point to the program is the main function. Upon investigating the source code inside of it, we first see the lines of code responsible for printing out the greeting message and then a call to the echo_print function. This function is what actually accepts the user input and prints it.

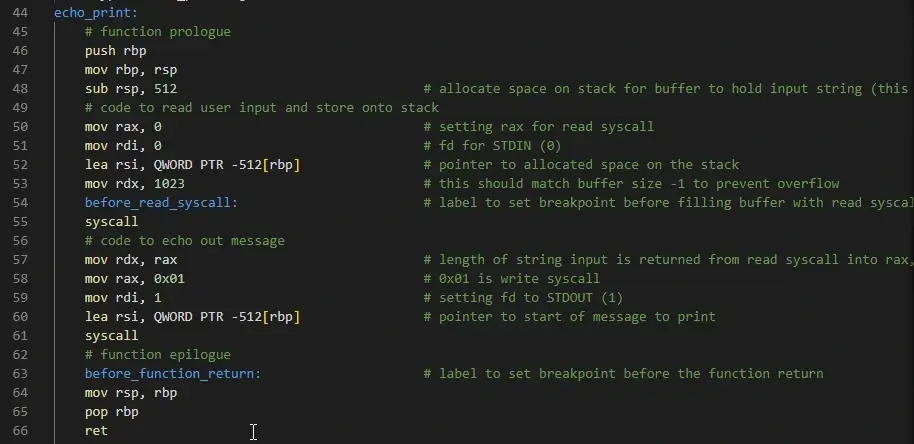
Inside the echo print function, the first few lines of interest are what are called the function epilogue. This part of the function preserves the stack for the caller of the function and sets up the call stack for the function to be placed on top of the previous caller’s stack. To do this, the caller’s basepointer is pushed onto the stack to preserve it, and then the basepointer is moved up to the current stack pointer. The basepointer is used to keep track of the base of the current stack frame.
After this, the stack pointer is moved down 512, and this is done to allocate 512 bytes of space on the stack (recall that the stack grows downwards). This space is used to temporarily hold the input string from the user. Because the call stack for the function is cleaned up when the function returns, any variables on the stack are local to the function only and deleted afterward unless they are moved to a more permanent location. This example in assembly is the same as if you were to allocate an array of data locally in a function with char buffer[512];.
The next lines in the function setup to perform a read syscall. A syscall is when control of the program is passed to the operating system to perform functionality, such as reading data via user input through the keyboard. In order to pass the parameters of the syscall to the operating system the registers of the processor are used. For a read syscall the location of where the data is read into is of importance. This is declared by passing a pointer into the read syscall, which points to the start of the buffer created on the stack into the RSI register.
The other parameter of importance is the limit of how many characters can be read via the syscall, which is passed in via the RDI register. This prevents overflows and should be set to a number smaller than the buffer created. In this example, the number of characters read is twice as much as the space allocated on the stack and, as such, allows for a buffer overflow on the stack, more specifically, a stack overflow.
Crafting an Exploit to Crash the Program
Armed with this knowledge of the internals, we can now overflow the stack and cause the application to crash. To do this, we’ll need to pass in more than 512 characters. We could do this manually; however, the best approach is to use a script, which will become imperative once we start to craft more complex exploits. Inside the repo, there is a pre-built Python script called exploit.py.

In the current format, the script is configured to write 526 A’s out in raw byte format. We will cover the reason for 526 in-depth later on in this blog. When learning about buffer overflows, it’s common to use A’s to fill up your buffer, almost akin to printing “Hello world!” when writing your first program.
If you run the Python script on its own:
python3 exploit.py
You should see it print out all of the AAAAAAAAAAs. We can pipe the output of this exploit into the stdin input of the Overflowme binary with:
python3 exploit.py | ./overflowme
If your exploit worked, it should have crashed the program with a segmentation fault.

Investigating the Crash with GDB
Segmentation faults happen when a program tries to access memory for which it doesn’t have permission or at an invalid address. In our example, it’s most likely the latter. To investigate why this happens when the stack has overflown, we’ll make use of the GNU Debugger, usually referred to as GDB. This will allow us to step through the program line by line and investigate the registers of the CPU and, most importantly, the memory, including the stack. Before we launch up GDB, let’s first create a file that includes the output of our exploit as it’s easier in GDB to read in from a file then pipe commands together (make sure you don’t give the file an extension as we want to ensure it stays in just the raw bytes output by the script with no magic numbers or other metadata).
python3 exploit.py > AAA
To launch up the program with GDB simply append the program you want to debug to gdb.
gdb ./overflowmeSetting up Checkpoints
First, we’ll set some breakpoints so that GDB halts at critical points of the program we want to investigate further. To set a breakpoint in gdb, type ‘b’ followed by a line number or a label name. To make debugging easier, I’ve included labels in the source code. When assembling this binary the -g flag is used to include debugging details such as the label. If you’re working on exploiting an “in the wild” binary, it is almost certain it won’t have debugging details like labels. Let’s set three breakpoints.
b before_function_call

b before_read_syscall

b before_function_return
Now we’re ready to run the program and direct the file we created into stdin:
r < AAA
Notice how GDB has automatically halted execution at line 81 directly before it runs the call to echo_print. I’ve set a break here so we can investigate some key pieces of information before jumping into the function. The first is where the basepointer is set inside the main function. We can check this with:
i r rbp
For me the base pointer is set to 0x7fffffffdd60, keep in mind that for you it may be different.
Noting Addresses
Next, we’ll check the return address from the function, this is the address where the program will jump to when the function returns. In our example, it will be the line directly after the call. I’ve added a label here to make it easier to find. We can display the address of a label or line with the following:
info address return_from_function
Again, keep in mind that yours may be different. For me, the return address is set to 0x5555555551bf. Let’s make a note of both of these values for when we jump inside the function.
Stack Overflow
To continue execution of the program in GDB, simply press ‘c’. The program will now halt inside of the echo_print function directly before it makes the ready syscall which will fill the stack up and overflow it with As. Recall that in the function prologue, the basepoint of the caller is saved above the call stack. Let’s verify this by investigating the contents of the memory above the stack. To do this, use the following command in GDB:
x/xg $rbp
The result will first display the starting address of the memory we’re reading from in blue, after that, it will then display the contents in white. The contents should match the basepointer from the main function we checked previously. Let’s quickly break down the command we just ran in GDB:
- x is the command for displaying memory
- / allows for formatting of the contents
- using x as a formatter tells GDB to return the contents of the memory in hex format (which for an address makes the most sense)
- g tells GDB to return a double word of data back
- $rbp tells gdb to get the contents pointed to by rbp
Essentially, we have displayed the contents of the 8 bytes above the current basepointer, which contains the stored based pointer of the caller. Next, let’s look at the 8 bytes above that using:
x/xg $rbp + 8
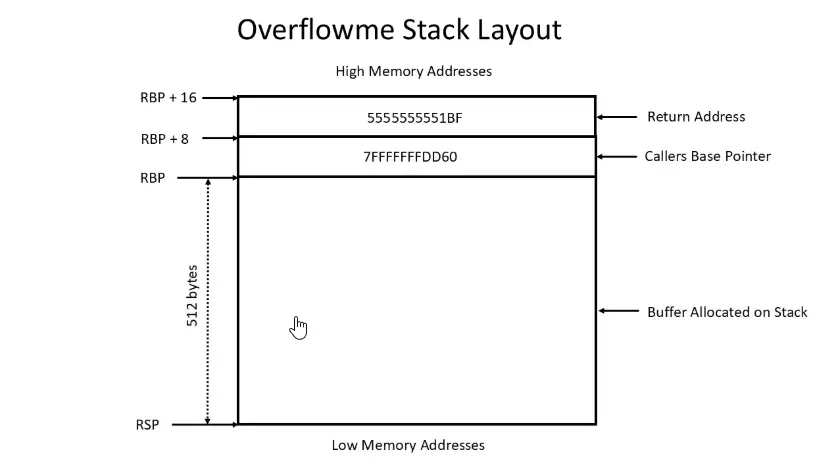
Notice that the value matches the return address we investigated before entering the function. This is critical to how programs function and also what makes stack overflows so dangerous. When performing a call to a function, the return address is pushed onto the stack so that program can access it after returning from the function. In normal operation, the function would clean up the stack, and when it calls return, the program can pop the return address off the stack and jump to it to return to the normal flow of the program.

The above diagram shows the layout of the stack before the buffer is filled up. Now, let’s fill it up and overflow it by continuing execution (with ‘c’ again). Notice that the program hasn’t crashed yet. This is because we halted execution before the function returns, however, the stack is still filled up and overflown. If you investigate the addresses above the stack again with:
x/xg $rbp

x/xg $rbp + 8
You’ll notice that they are both filled up with “41”s (the hexadecimal ascii representation of A). When the program returns from the function, instead of returning back to the main function where it left off, it will attempt to jump to 4141414141 and execute the instruction there, which is what gives the segmentation fault. When you press ‘c’ for a final time, you’ll see this happen.
Now that we understand how the basics of the stack overflow works we can work towards crafting an exploit that, instead of filling the return address with A’s, fills it with the address of where we want it to jump to. Before we exit GDB to do that, let’s get the address we want. To do so, re-run the program inside GDB again with ‘r’ and then check the address of the hidden_print function with:
info address hidden_print
Mine is at 0x555555555129, but as before, yours may be at a different address. Keep note of whatever it is, as you’ll need it to craft the final exploit. Now, we can exit GDB with ‘exit.’
Updating the Exploit to Control Program Flow
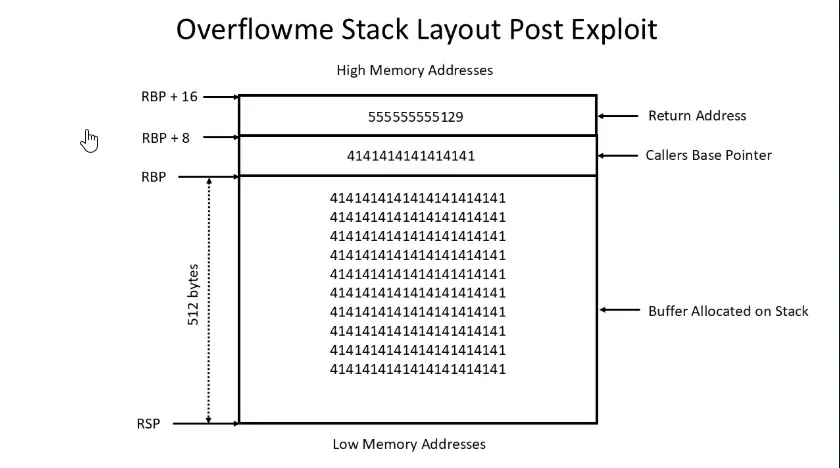
Revisiting the exploit, with our new knowledge of how the call stack works when setting up for and returning from a function, we can make sense of why we need the specific amount of As. The first 512 fills up the space allocated on the stack. The next 8 bytes fill up where the caller’s base pointer is stored. Finally, the return address we want to jump to is placed last in the exploit string – the memory location where the program will look for the return address. One thing to note is that the bytes need to be stored in reverse order so they are pushed into the memory in the proper order.

With the exploit updated again let’s store the output of it into a file so we can use that in GDB.
python3 exploit.py > jmp2hidden
Now, let’s re-run this binary in GDB again using the new file and set a breakpoint for before_function_return.
gdb ./overflowme

b before_function_return

r < jmp2hidden
Execution halts right before we return from the function, so now let’s check the callers basepointer and return address on the stack.
x/xg $rbp

x/xg $rbp + 8

The caller’s base pointer is still overwritten with A’s; however, now the return address is pointing to the hidden_print function we want to jump to. You can re-verify this with:
info address hidden_print
Notice how it matches the address in the stack we just checked. If you continue execution with ‘c’ you’ll see the hidden message printed out, and then the program crashes with a segmentation fault.
Congratulations, you’ve pulled off a buffer overflow exploit! By overflowing the stack into the return address with a known address of code we shouldn’t have had access to, we’ve exploited the program. Sometimes, just this act of being able to jump to other code is enough to be critical such as jumping past checks or authentication. In the next level of Overflowme we’ll look at how we can pull off a classic stack-smashing attack by using the space in the buffer to hold our own code we want to execute and then setting the return address to jump to that.
Intro to Address Space Layout Randomization
Before we wrap up this level, let’s quickly see what happens when we try to run this exploit outside of GDB. Using the same process as before, we can pipe the output from the exploit into the binary.
python3 exploit.py | ./overflowme
You will most likely now only get a segmentation fault without printing the hidden message. This is because of one of the protections built into operating systems to prevent memory corruption vulnerabilities such as stack overflows called Address Space Layout Randomization (ASLR). When ASLR is enabled, the operating system will load the binary into memory in a random layout that changes with each execution. This means things like the data inside the binary, the function, and (importantly) the stack locations are always different. Because of this, when we try to jump to where we thought the hidden_print function is we just get a segmentation fault.
By default, GDB disables ASLR because it makes debugging harder. This is why we were able to run the exploit inside of GDB. There are some ways to get around ASLR by chaining together vulnerabilities, and we’ll look at this in further levels of Overflowme. If you want to learn more about ASLR and another of the core built-in protections against stack overflows called stack canaries, make sure to check out this walkthrough of Overflowme level 1 YouTube video, which has some additional details!
Looking for More?
While you wait for the next level to drop, if this exercise has excited you about learning the language of the machines, check out our Assembly 101 course for a deeper dive into this low-level coding language.
If you enjoyed the exploit creation and execution aspect and want to explore certification in ethical hacking, then the Practical Junior Penetration Tester (PJPT) would be a good starting point. For more advanced white hats, the Practical Malware Research Professional (PMRP) will broaden your understanding of malware research and demonstrate your abilities in that realm.

About the Author: Andrew Bellini
My name is Andrew Bellini and I sometimes go as DigitalAndrew on social media. I’m an electrical engineer by trade with a bachelor’s degree in electrical engineering and am a licensed Professional Engineer (P. Eng) in Ontario, Canada. While my background and the majority of my career has been in electrical engineering, I am also an avid and passionate ethical hacker.
I am the instructor of our Beginner’s Guide to IoT and Hardware Hacking, Practical Help Desk, and Assembly 101 courses and I also created the Practical IoT Pentest Associate (PIPA) certification.
In addition to my love for all things ethical hacking, cybersecurity, CTFs and tech I also am a dad, play guitar and am passionate about the outdoors and fishing.
About TCM Security
TCM Security is a veteran-owned, cybersecurity services and education company founded in Charlotte, NC. Our services division has the mission of protecting people, sensitive data, and systems. With decades of combined experience, thousands of hours of practice, and core values from our time in service, we use our skill set to secure your environment. The TCM Security Academy is an educational platform dedicated to providing affordable, top-notch cybersecurity training to our individual students and corporate clients including both self-paced and instructor-led online courses as well as custom training solutions. We also provide several vendor-agnostic, practical hands-on certification exams to ensure proven job-ready skills to prospective employers.
Pentest Services: https://tcm-sec.com/our-services/
Follow Us: Email List | LinkedIn | YouTube | Twitter | Facebook | Instagram | TikTok
Contact Us: sales@tcm-sec.com
See How We Can Secure Your Assets
Let’s talk about how TCM Security can solve your cybersecurity needs. Give us a call, send us an e-mail, or fill out the contact form below to get started.
 New Horizons
 Project Management Academy
 Six Sigma Online
 TCM Security
 TRACOM
 Velopi
 Watermark Learning
 Login
Login


